How to Track What Users Hate About Competitor Products
Reading competitor reviews once shows a snapshot. A monthly count per theme, with dates, shows what's getting worse. Here is the routine, step by step.
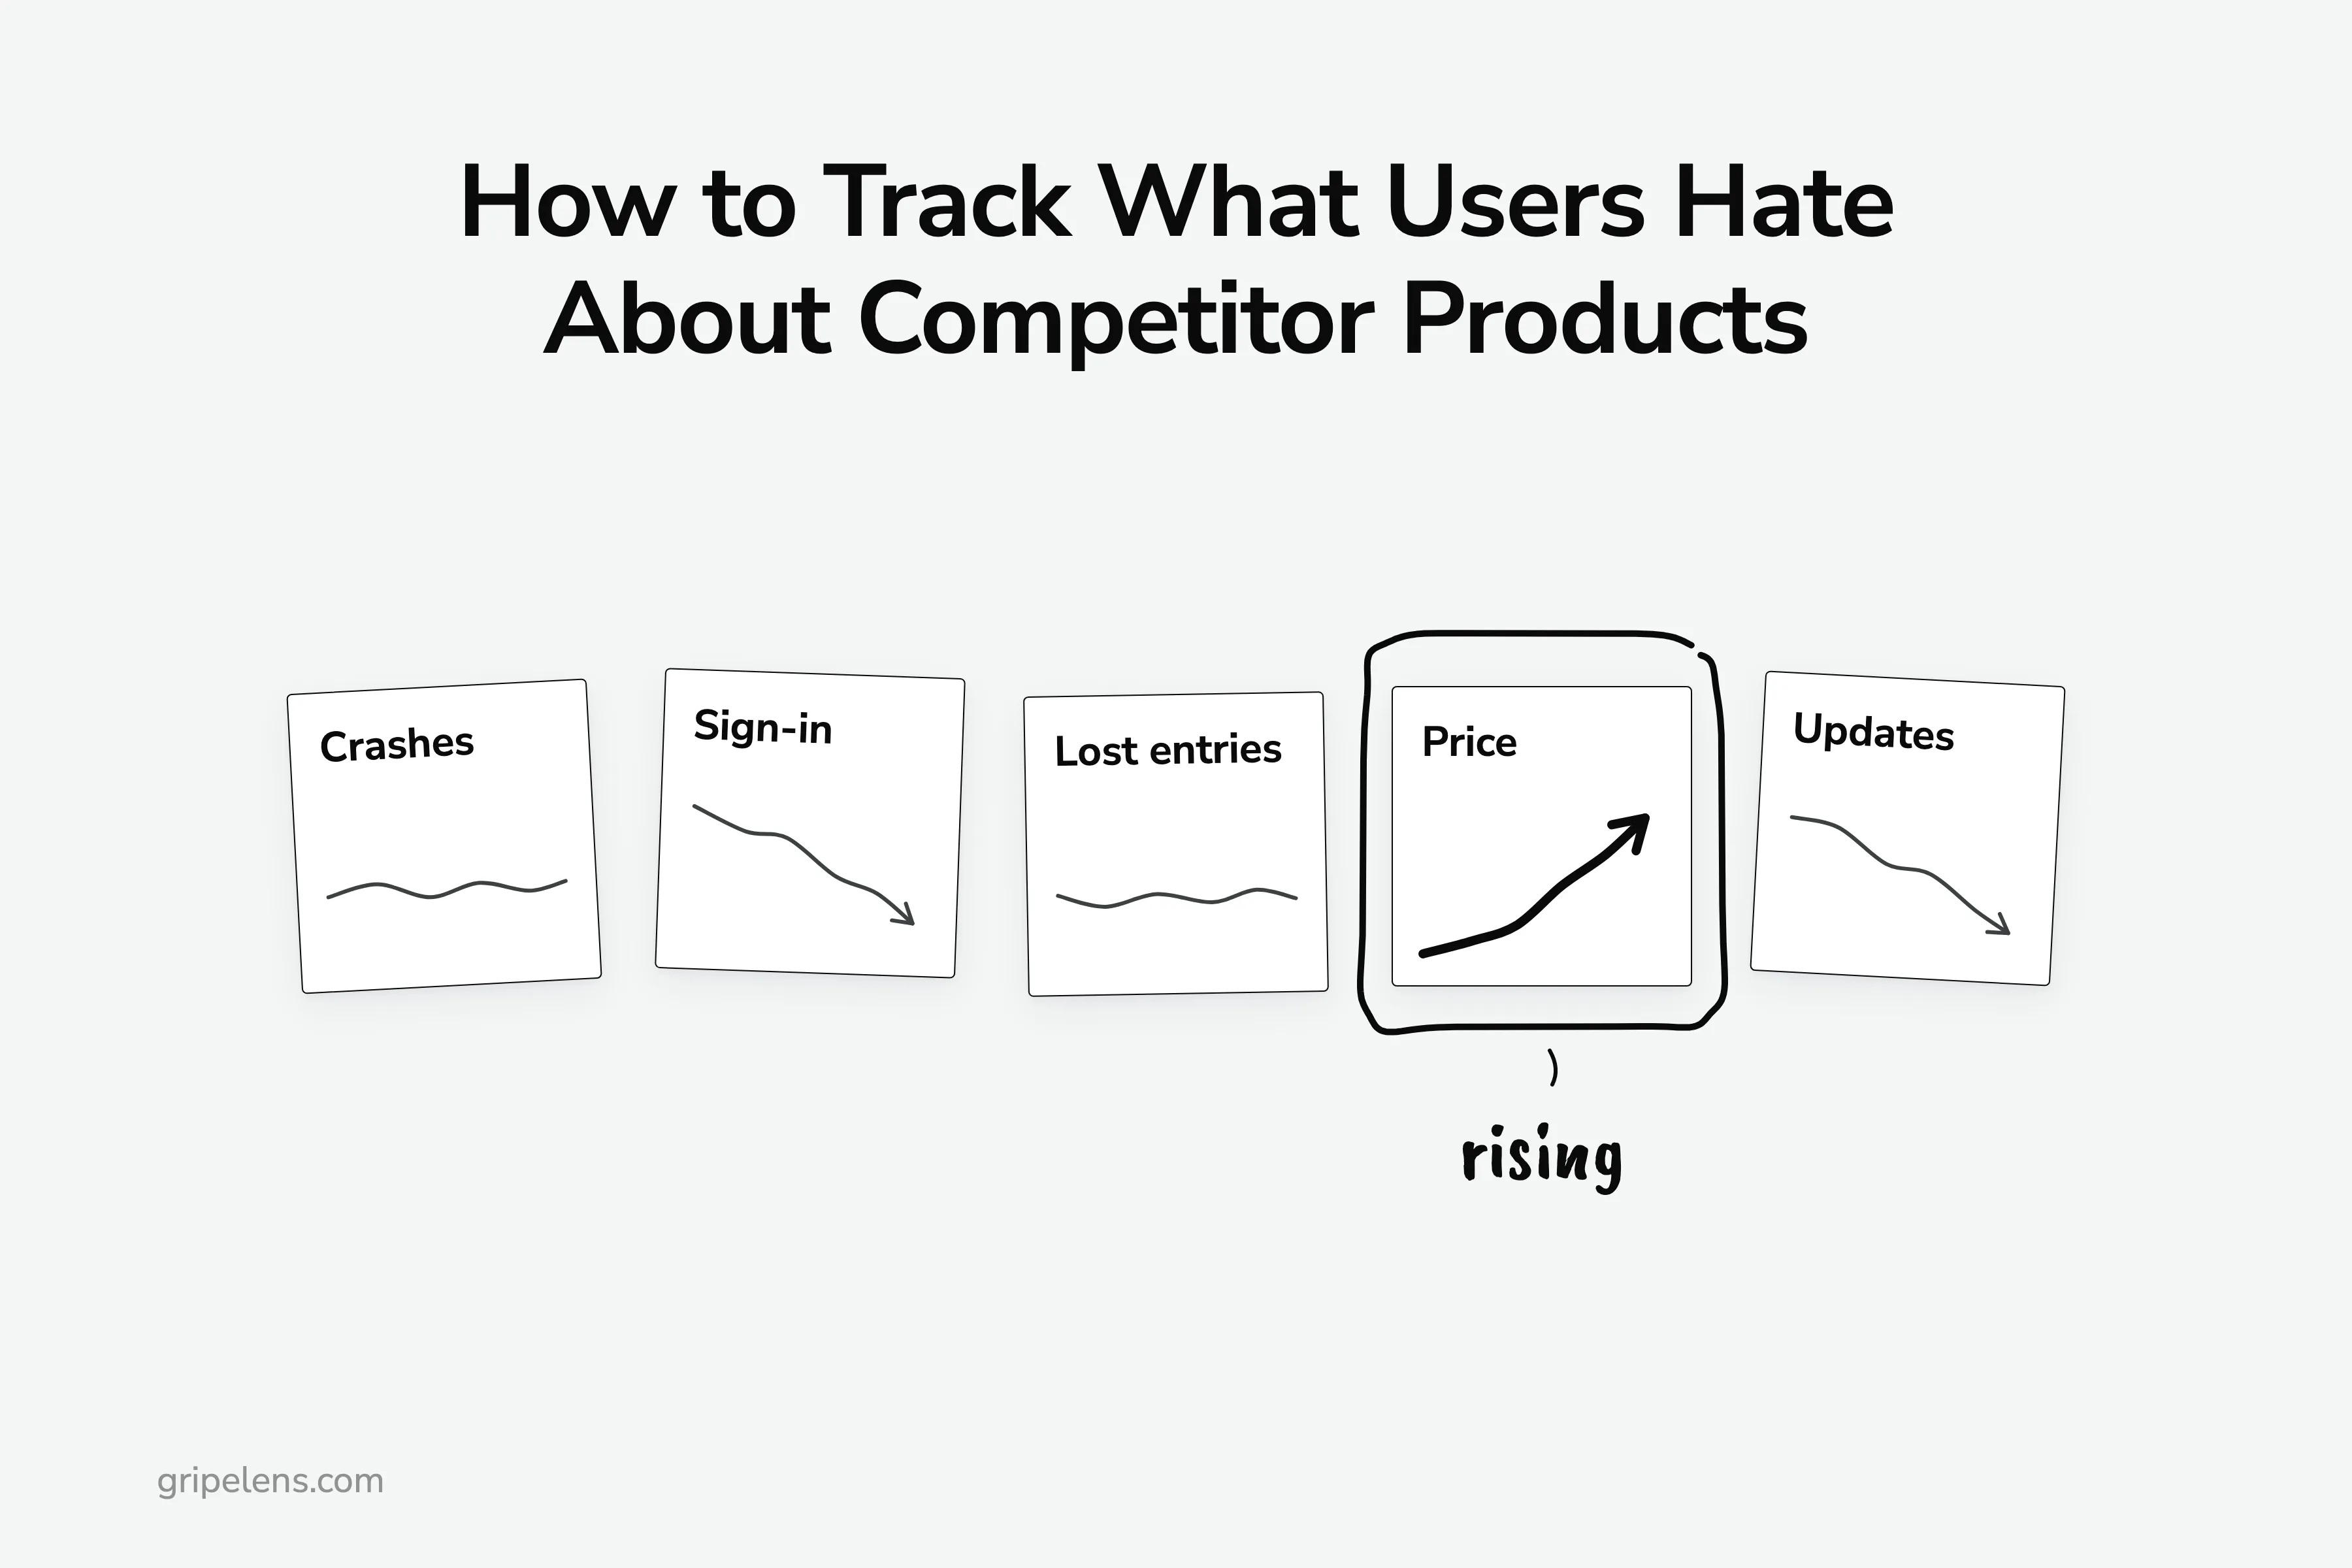
To track what users hate about competitor products, use six steps, most of them monthly: log every complaint with its date, source and link, code it into a theme list you never rename, and compare each theme’s count with the previous six months. A PM on r/ProductManagement spent “3 hours going through Notion’s GitHub discussions” in January 2026 and named the gap a one-off read leaves: “Can’t track changes over time.”
I research competitor reviews by hand before building anything: for this product I logged 36 tools in the category with their prices and 101 quoted complaints, each with its source and date, and I coded 261 negative items (App Store and Trustpilot reviews, plus the “what do you dislike” answers in G2 reviews) about five time trackers for a sample report.
Below: which sources to watch and how each one is biased, what to pull each month, the log columns, the fixed theme list, how to read a trend, and when an old complaint or a sudden burst of reviews shouldn’t count.
Key takeaways
- Track complaints monthly, not once: log each one with a date, source and link, code it into a fixed theme list, and compare this month’s count per theme with the last six.
- In my time-tracker sample, price was 67 of 261 negative items and 61 of those 67 came in the last six months, while sign-in complaints and “an update made it worse” trended down; a single read ranks price first but can’t tell you it’s rising.
- Flag anything older than 18 months as “may be fixed”: that was 53 of 261 items in the same sample.
- Check the dates before you trust a jump: nine of the ten newest Toggl reviews on G2 share one day.
- Every source has a bias (GitHub feature requests come from power users, low-star filters show the worst case), so mix at least three.
Step 1: Pick Three Competitors and the Places Their Users Complain
Start with three competitors: the ones your buyers name when they compare you with someone else. Three is enough to show a pattern and few enough to read every month. Not sure who they are? Start with finding the competitors worth tracking.
Then pick four or five sources. Each one hears from a different kind of unhappy customer:
- Review sites (G2, Capterra, Trustpilot). Dated and easy to sort by newest. “G2 and Trustpilot are full of people venting mid-ticket, not after it,” as u/WillingDinner3243 wrote on r/GrowthHacking. Low-star filters only show the worst case, which is why I take G2 cons (the ‘what do you dislike’ box) at any star rating.
- App stores (App Store, Google Play). Volume, but short and emotional, often about one update. In my sample, 859 of the 2,685 App Store reviews I read were 1 to 3 stars.
- Reddit. Comparison threads and “why I left” posts from people mid-switch. In the r/ProductManagement thread, u/Apprehensive_Pen3729 put it well: the most valuable hate “shows up in comparison threads, migration stories, or casual comments where people explain why they left”.
- GitHub issues and discussions, for products with a public repo or community. Feature requests (FRs) come with reaction counts, but they skew: “people who submit FRs in GitHub are the top 0.01% of power users,” as u/the_phantom_streak suspects in the same thread.
- LinkedIn. Public rants. Same commenter: “Troll LinkedIn, people will happily complain if it gets them fake internet points.”
Why mix them?
Because one product shows different problems in different places. Mark Li (@iammutex) found a merchant on Reddit drawing the line at build-your-own bundle packs, while an App Store reviewer of the same app just wanted backend bundle sync. His summary: “same app, different problems.”
Step 2: Pull Only What Is New Since Last Month
Pick a fixed day each month and keep it. On each source, sort by newest and stop when you reach last month’s date. Everything above that line is this month’s pile.
What goes in the pile:
- 1 to 3 star reviews from the app stores and Trustpilot, where stars are the only filter
- the cons field (the “what do you dislike” box) of every G2 and Capterra review, 4 and 5 stars included
- Reddit and GitHub results for the competitor’s name plus phrases like “switched from”, “cancelled”, “alternative to”, “still no” and “workaround”
That phrase list is mine, built from the threads I’ve read. Add the words your market uses.
Why bother with 5-star reviews?
Because that’s where the complaints hid when I did this for real. On 7 October 2026, most Capterra reviews of the review-analysis tools I was researching were 4 or 5 stars, so most of my 101 complaints came out of the cons fields of positive reviews.
On GitHub, sort issues and discussions by newest for this month’s pile, then by reactions to see which requests have the most people behind them. GitHub’s docs list the sort options for issues, including newest created and most reactions.
Budget extra time for Reddit. For that 101-complaint table I spent about 40 minutes on slow retries against an archive API (a third-party store of old Reddit posts), and only 5 Reddit comments made it in. Read the thread pages by hand, and plan for it.
Step 3: Log Every Complaint With a Date, a Source and a Link
Every review gets one row in a plain spreadsheet, however many themes it carries. The date column matters most: without it you have a pile, not a trend.
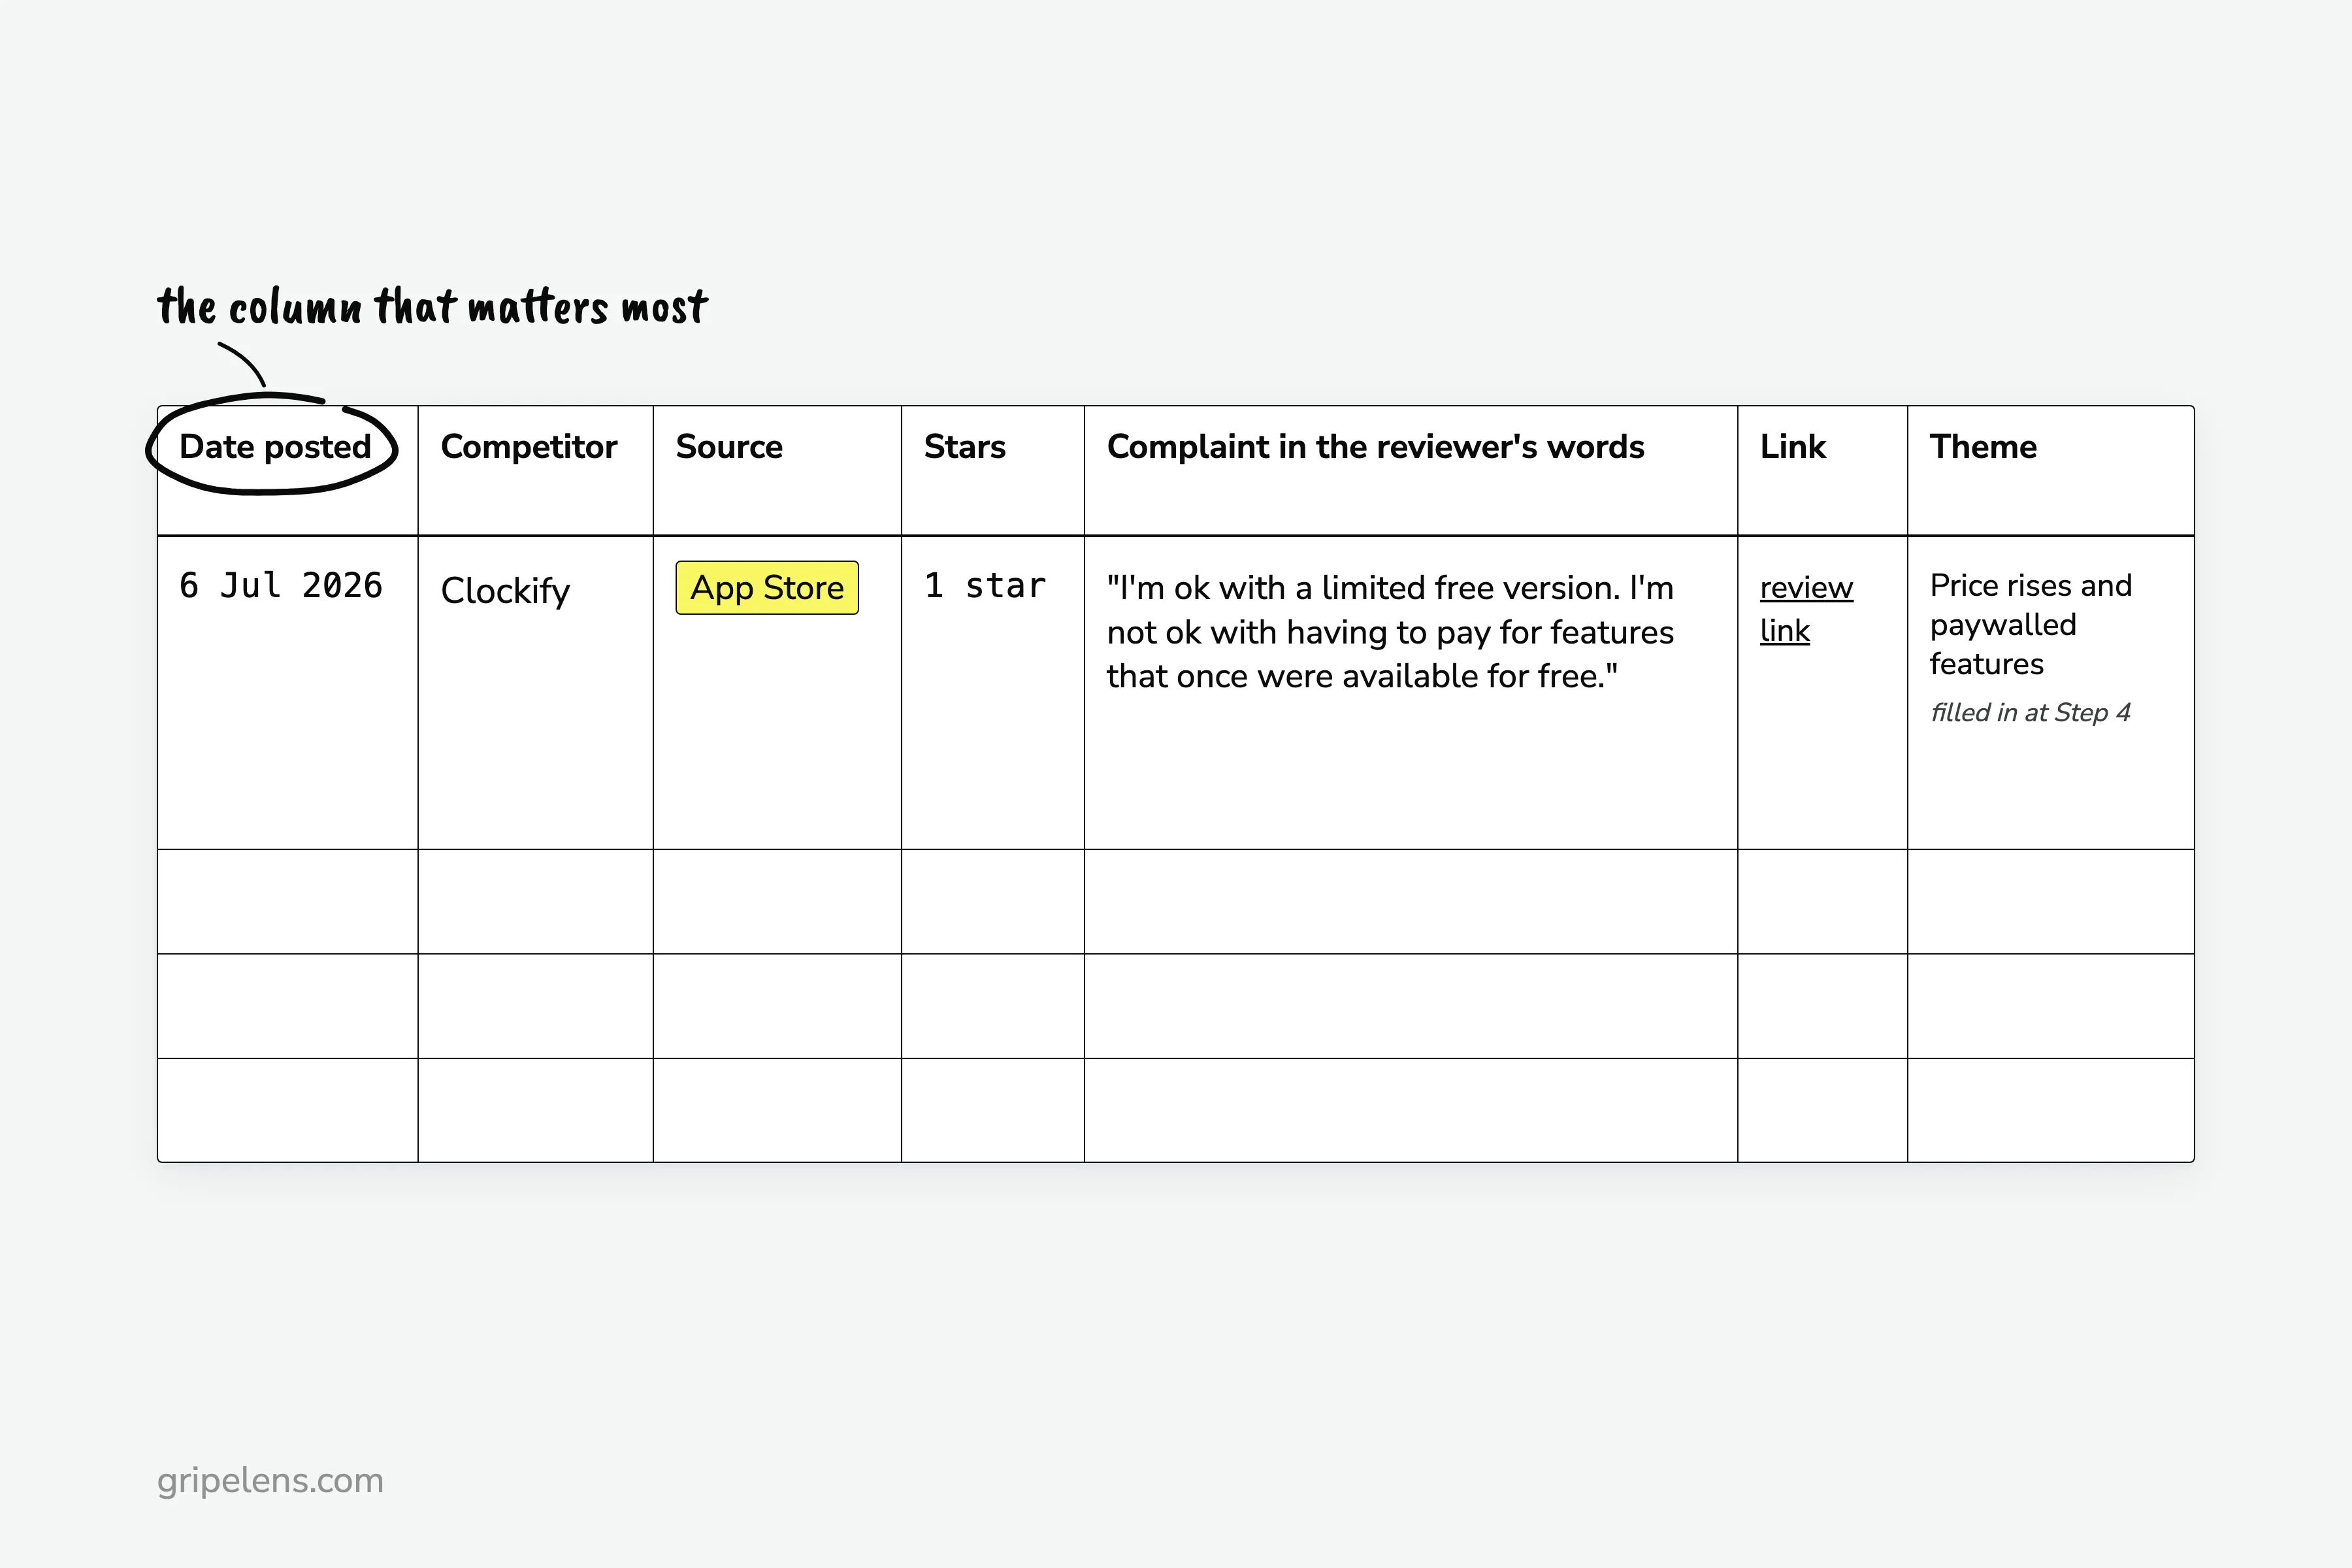
The columns:
- Date posted
- Competitor
- Source
- Stars, if the source has them
- The complaint, in the reviewer’s words
- Link
- Theme (blank for now; Step 4 fills it in, and a row can carry more than one)
What does a real row look like? Here’s one from the time-tracker run: 6 Jul 2026, Clockify, App Store, 1 star, “I’m ok with a limited free version. I’m not ok with having to pay for features that once were available for free.”, the review link, and later the theme “Price rises and paywalled features”.
Under each quote, add one line in your own words. Rewrite each complaint as “The user was trying to accomplish X but couldn’t because Y,” as u/Efficient_Mud_4141 suggests on r/ProductManagement.
The same commenter warns that competitor reviews “usually highlight emotional friction, not actual feature gaps”. The rewrite is the fix: an angry line becomes a task someone couldn’t finish.
It also answers the r/ProductManagement PM’s “No easy way to filter ‘complaints’ from ‘bug reports’”. A bug report says what broke. The rewrite says what someone couldn’t get done, and that’s the part worth tracking against a competitor.
Each month the rows roll up into one row per theme; a report template with first-seen and last-seen columns shows that summary.
Step 4: Code Each Complaint Into a Theme List You Never Rename
After the first month, read your rows and write about ten themes. Then freeze the names.
Why so strict? Rename “billing” to “pricing” in month four and the comparison breaks, because the old counts sit under a label that no longer exists. Here are the ten from my time-tracker report, as an example:
- Price rises and paywalled features
- Crashes and freezes
- Logged out and sign-in failures
- Lost entries and sync failures
- Clunky time entry
- Missing features
- Surprise charges and no refunds
- Support unreachable
- An update made it worse
- Mobile app lacks web features
Three rules keep the list stable:
- Add a new theme only when three or more items need it.
- Keep an “other” bucket. In the sample, 19 items fit no theme.
- Merge paraphrases: “When the same complaint shows up phrased five different ways, that’s usually the real insight,” in u/Apprehensive_Pen3729’s words.
Count every theme as “N of M”, where M is that month’s items for that competitor. Mark Li’s “15 of the last 27 complaints” about one product is the right shape. A bare 15 tells you nothing.
A review that carries two themes counts once toward each theme, and once toward M.
Mark thin samples too. Everhour had 3 negative items in my sample and Timely had 12, so I labelled both thin and drew no trend from either.
If your first month starts with a big backlog, coding a big pile of reviews into themes covers how to sample it.
Step 5: Compare This Month With the Last Six
Each month, add a column. Read each theme’s row as rising, flat or falling against the six months before it: a rising theme with a dated cause, like a price change or a release, is the signal, and a theme with no new items for six months may be over.
Here’s the blank grid. It’s a template, so it has no numbers:
| Theme | Month 1 | Month 2 | Month 3 | Month 4 | Month 5 | Month 6 | This month | Direction |
|---|---|---|---|---|---|---|---|---|
| Price rises and paywalled features | ||||||||
| Crashes and freezes | ||||||||
| (one row per theme) |
Does a dated count show anything a one-off read doesn’t?
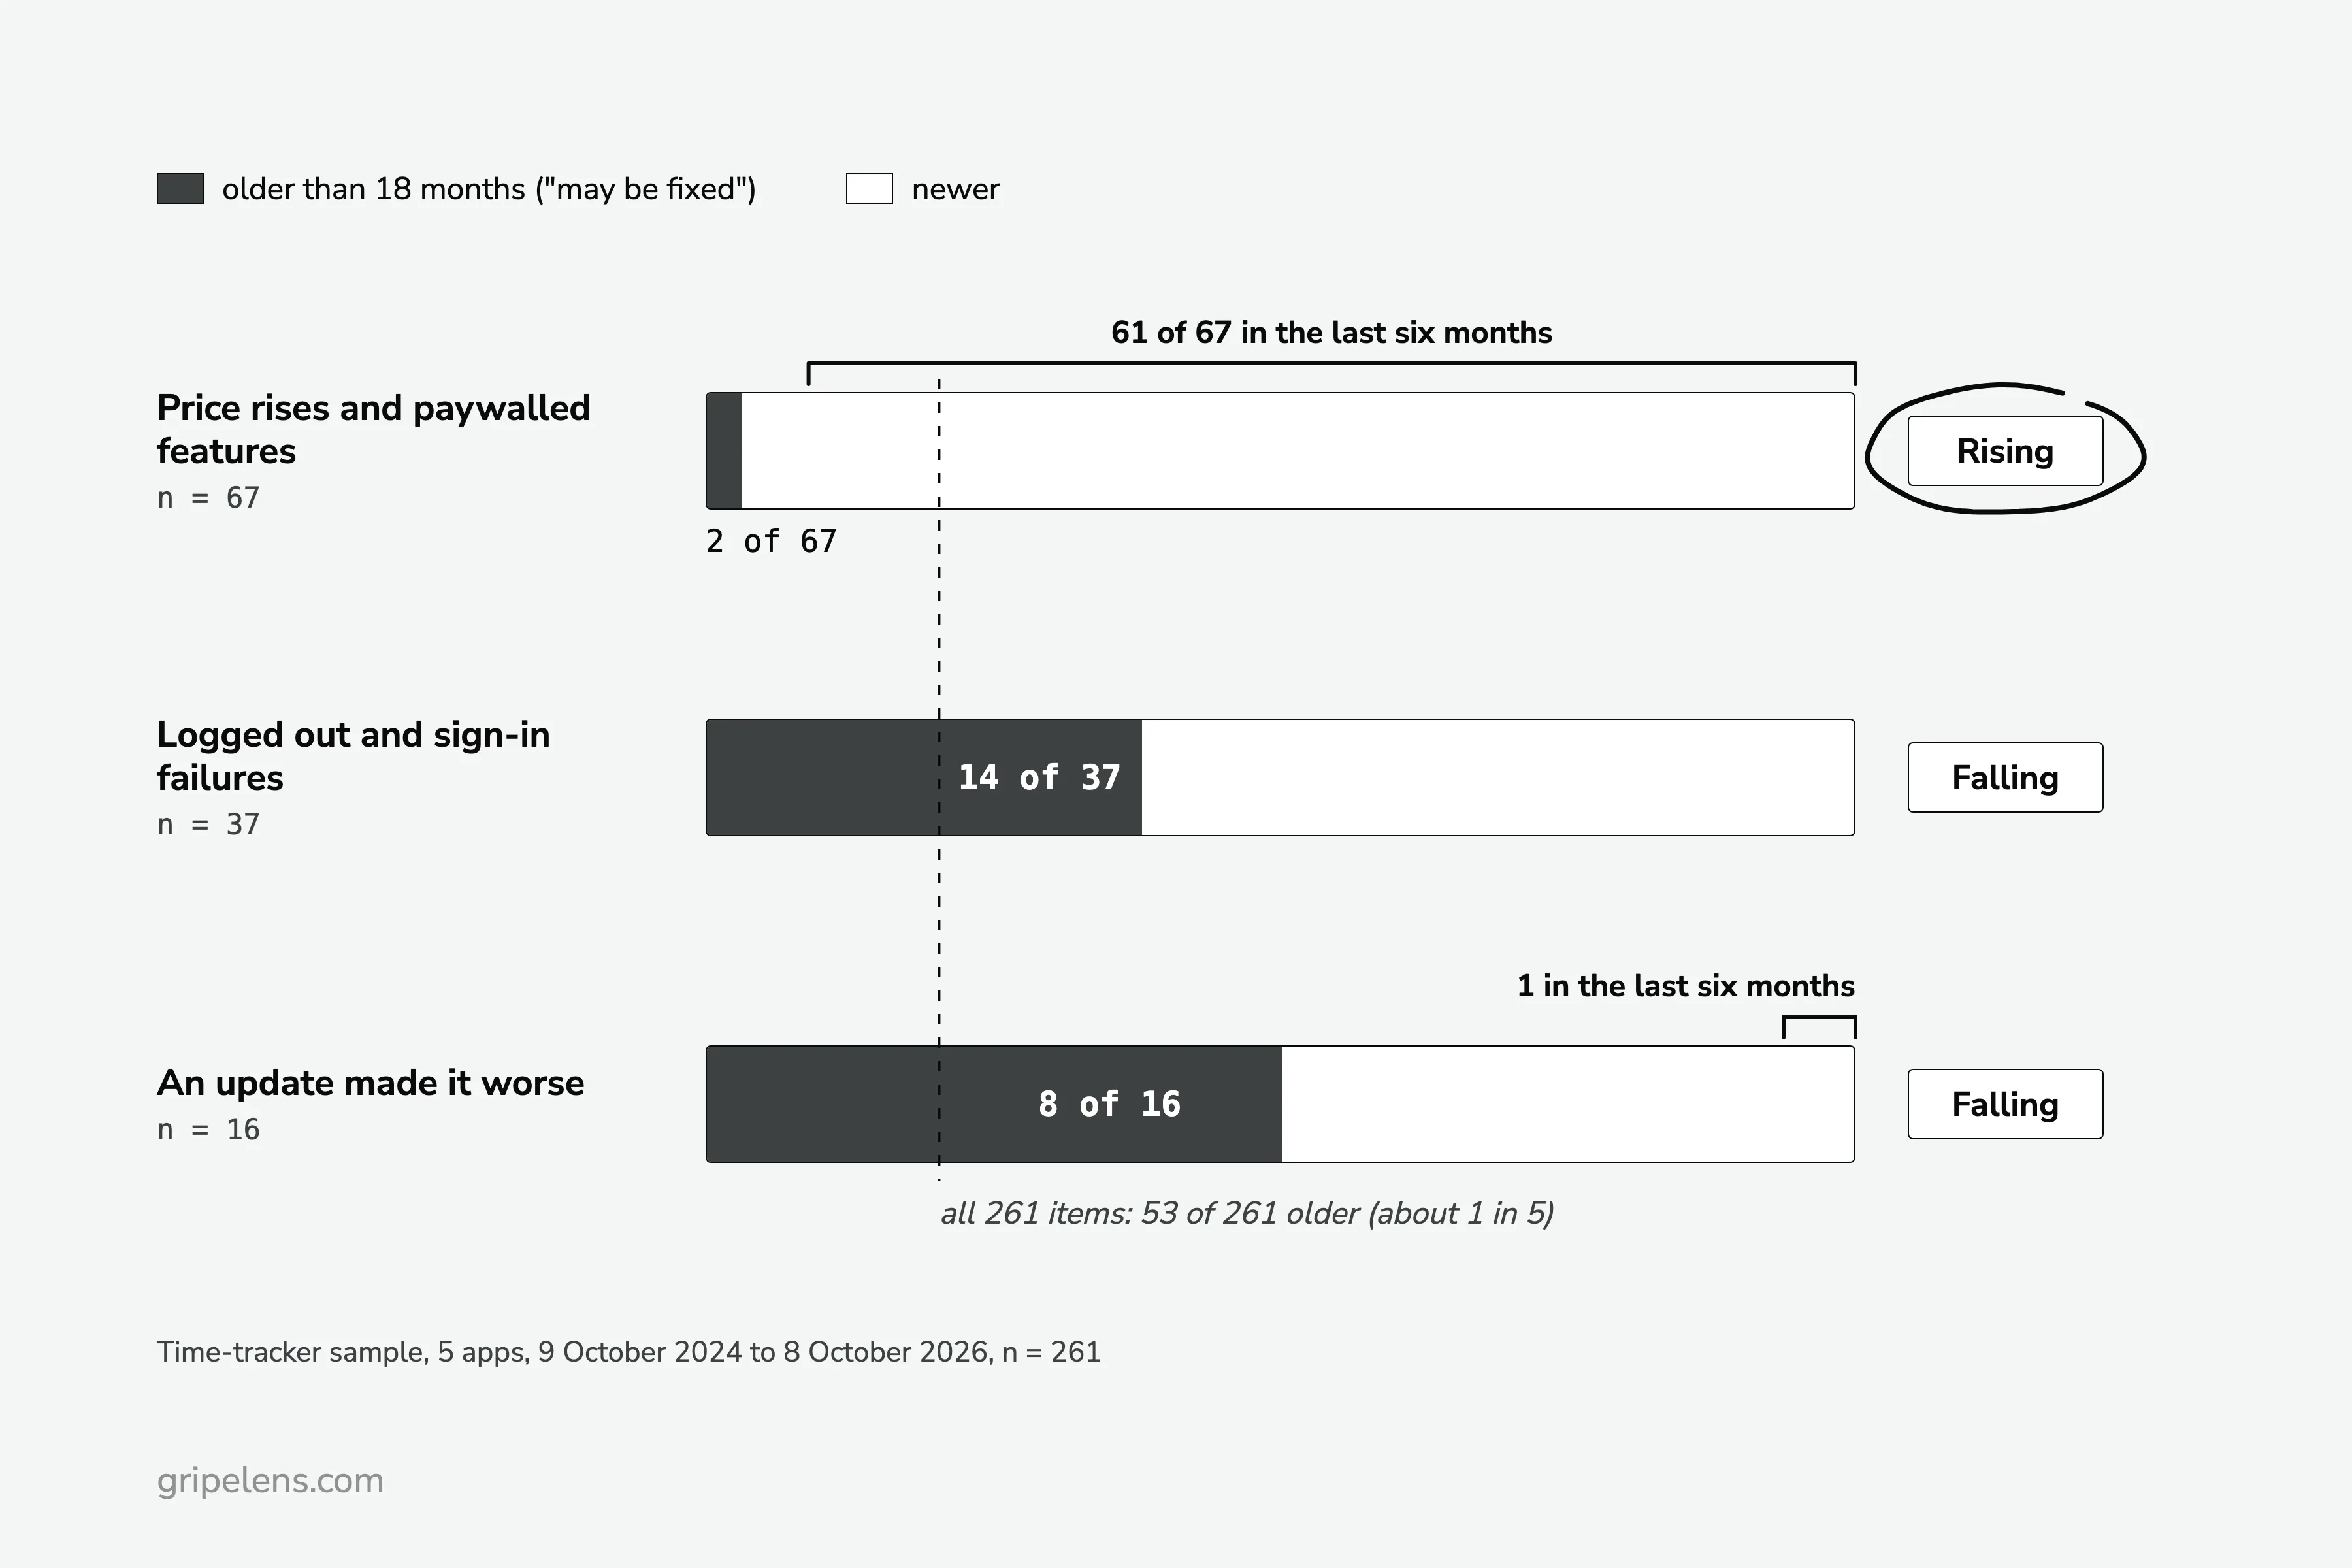
My sample report has no per-month counts, but every item has a date, and that’s enough to read direction. Five time trackers, 9 October 2024 to 8 October 2026, n = 261 negative items:
| Theme | Items in 24 months | Older than 18 months | Last seen | Direction |
|---|---|---|---|---|
| Price rises and paywalled features | 67 | 2 | 2026-10-05 | Rising: 61 of 67 in the last six months |
| Crashes and freezes | 41 | 8 | 2026-10-06 | Falling |
| Logged out and sign-in failures | 37 | 14 | 2026-10-02 | Falling |
| Lost entries and sync failures | 33 | 7 | 2026-09-09 | Falling |
| An update made it worse | 16 | 8 | 2026-05-30 | Falling: 1 item in the last six months |
“Falling” is the sample report’s 24-month trend label, and the table shows it plainly for two rows. Across all 261 items, 53 (about one in five) are older than 18 months. Sign-in sits well above that at 14 of 37, and “an update made it worse” at 8 of 16. Crashes (8 of 41) and lost entries (7 of 33) sit near one in five, so for those two, “Falling” is the report’s call, not something this table proves. Price, at 2 of 67, is almost all recent.
Two dated events drove the price row. Harvest repriced in 2026 after the Bending Spoons acquisition, and that alone was 38 of Harvest’s 70 negative items. Clockify cut its free plan, live from mid-June 2026, which was 26 of Clockify’s 78.
A snapshot ranks price first. The dates show price rising while sign-in and “an update made it worse” trend down.
How should you read a rising price theme? Greg Isenberg’s rule: “if people complain about the price but keep paying, that’s demand. if they complain about bugs, that’s your opening”.
My one caveat: a rising price theme next to switching mentions is the stronger opening, because those people are leaving, not grumbling and staying.
Merging months across five sources and keeping the counts comparable is the step that hurts most by hand. Keep it in the sheet, or have Gripelens do this step for the review sites, app stores and Reddit, while GitHub and LinkedIn stay in your sheet. Its freshness trends show each theme over time and flag quotes older than 18 months “may be fixed”. The sample report shows the output format.
Step 6: Flag Old Complaints and Bursts Before You Trust a Trend
Two checks before a trend goes into a pitch or a roadmap doc. Is the complaint still current? And did a burst of reviews, real or arranged, push the number up?
Start with age. I flag anything older than 18 months at the run date as “may be fixed”. In the sample that was 53 of 261 items, spread unevenly: sign-in carried 14 of its 37, price only 2 of 67.
Keep flagged items in the count, and check the competitor’s current version before you quote one.
Where does 18 months come from? It’s my rule, so treat this as rough.
One r/SaaS commenter goes much harder: “anything older than 6 months is probably irrelevant anyway”. That’s one person’s opinion, and it throws out complaints that are still live. Mark Li’s rule handles them better: “if the same complaint keeps showing up for months, that one’s still live”.
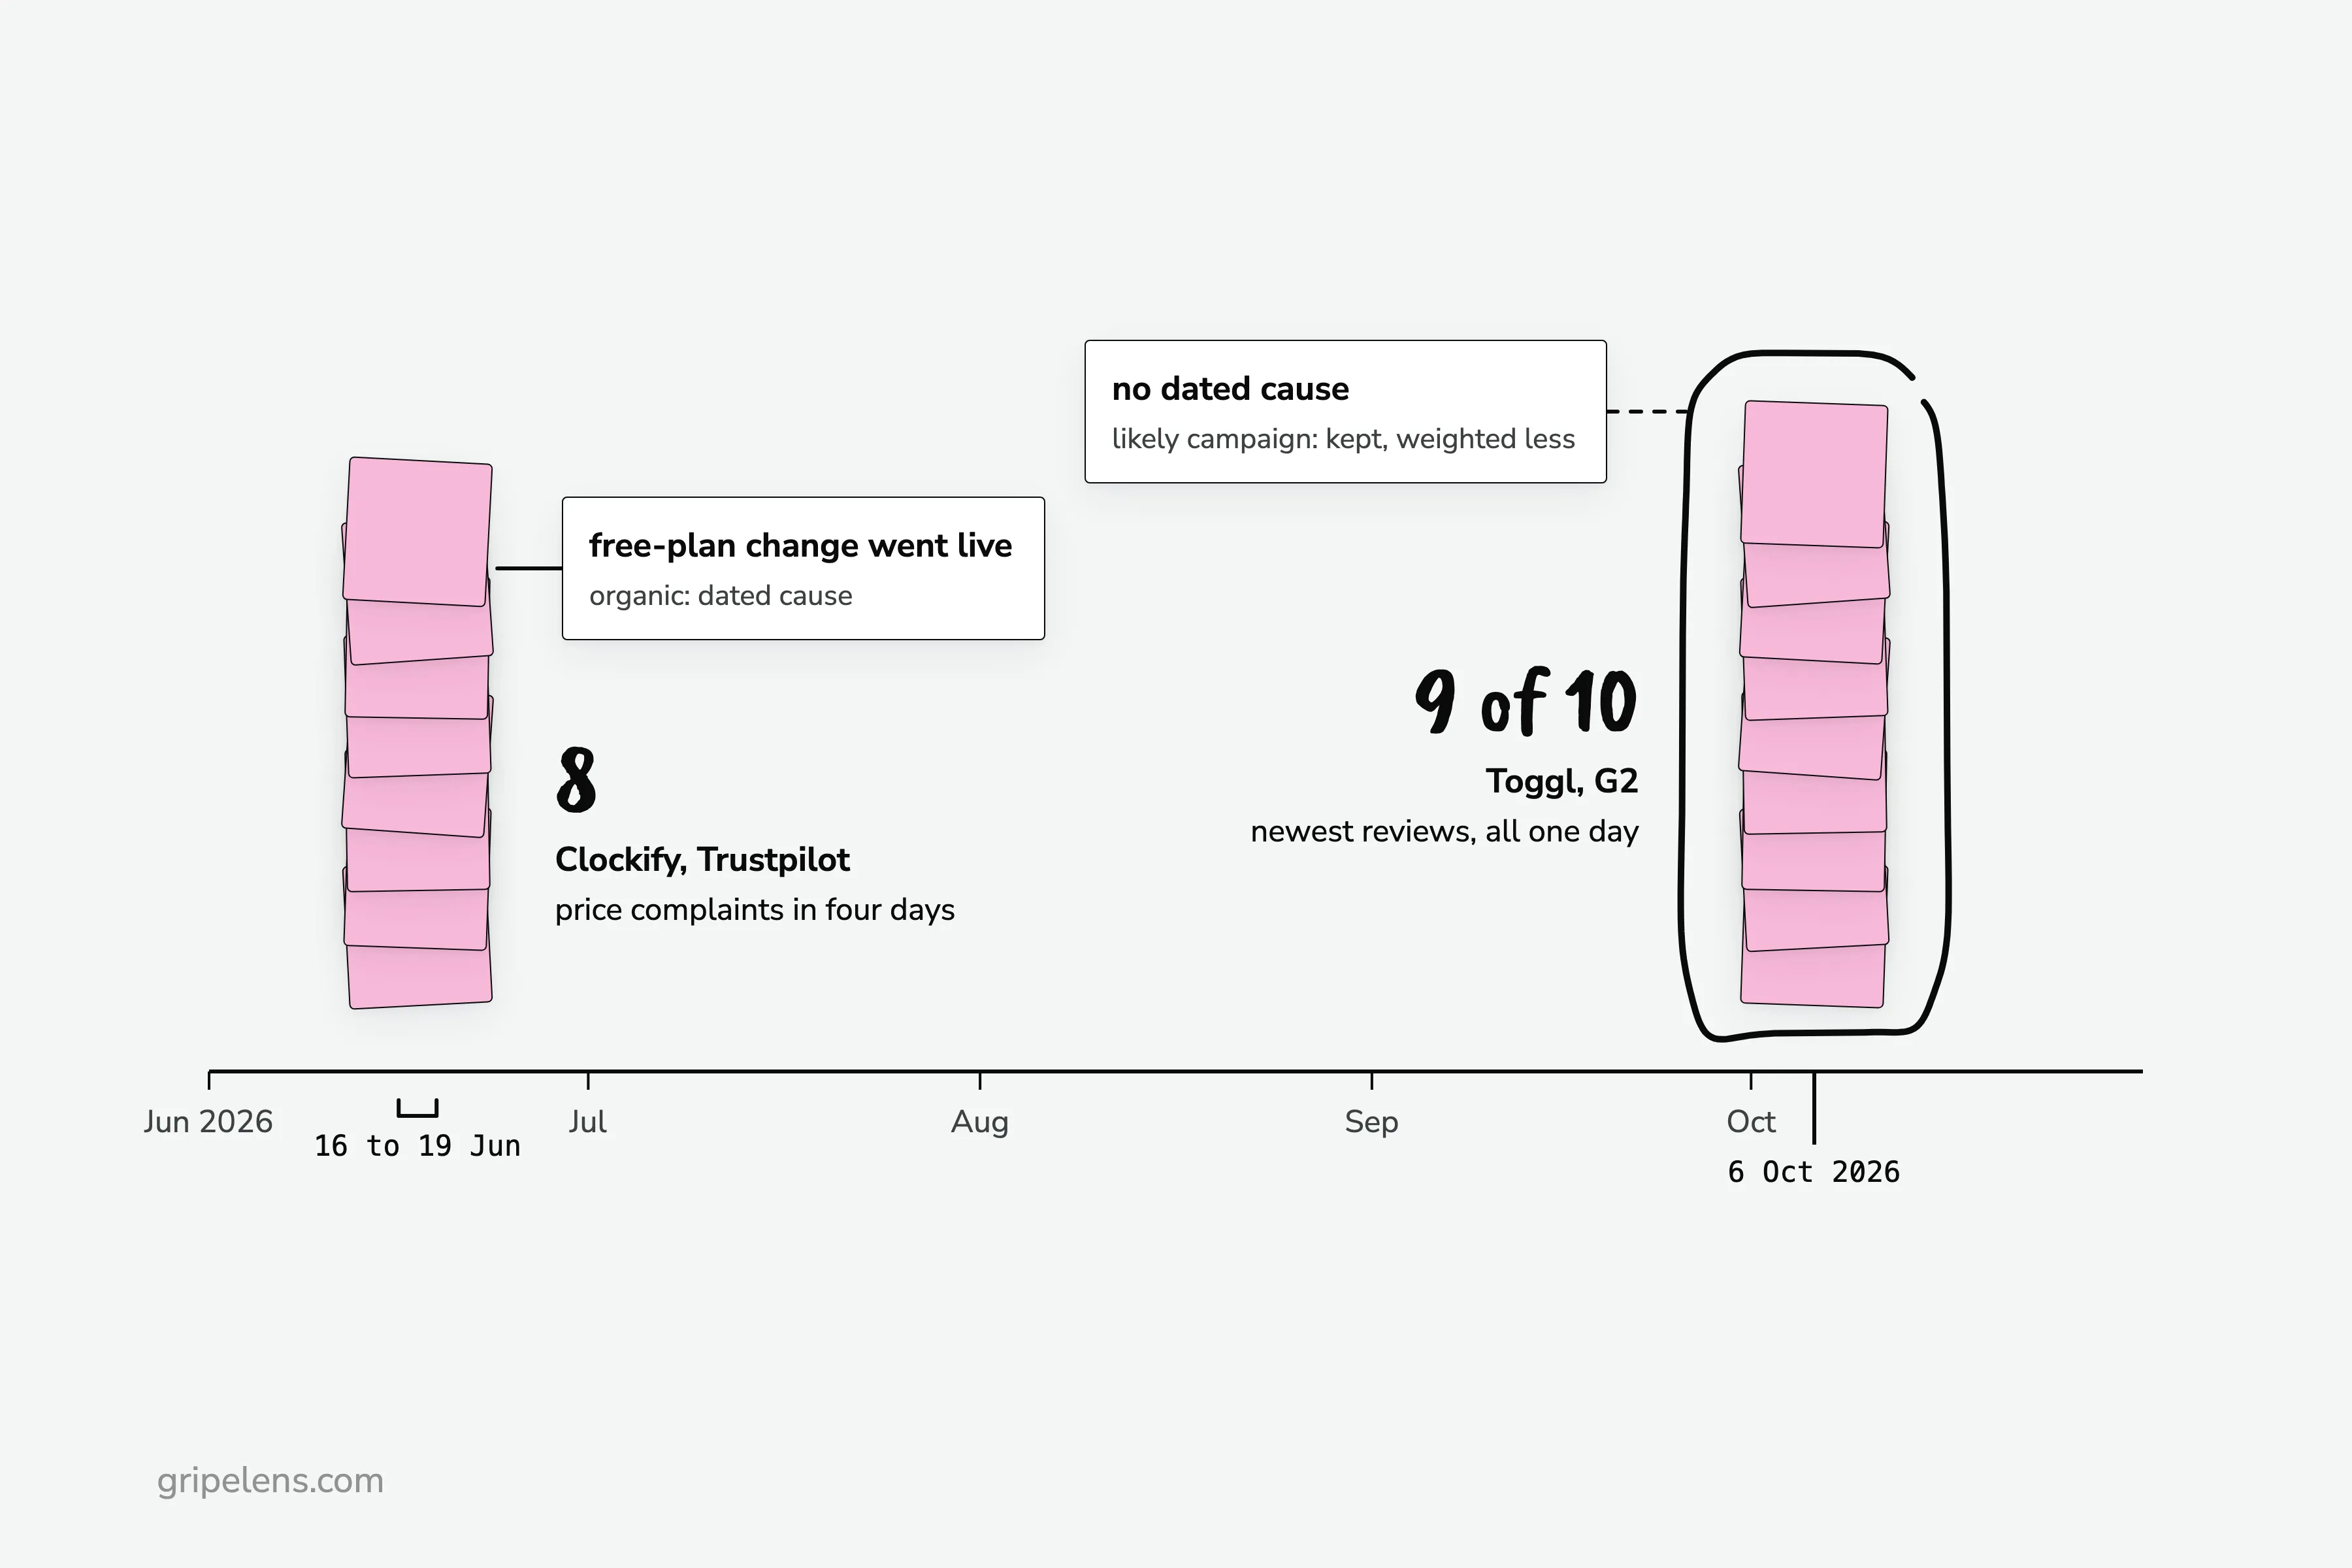
Then bursts. An organic burst has a dated cause: Clockify got 8 price complaints on Trustpilot in the four days from 16 June 2026, right after its free-plan change went live.
A likely campaign has none: nine of the ten newest Toggl reviews on G2 are dated 6 October 2026, so I kept their cons but weighted them less. Everhour’s 10 Trustpilot reviews were all 5 stars, which reads as solicited, so I didn’t count them.
So what do you do with a sudden jump? Find its date, then look for a cause: a pricing change, a release, an acquisition. If there isn’t one, run the date check for review bursts before the number goes anywhere. A burst is one of five checks; the full pattern test adds share of n, sources, recency and cause.
How Much Time Does This Take, and Is It Worth It?
The PM from the opening spent 3 hours on one competitor’s GitHub discussions. In the same thread, u/coffeeneedle suggests “30-60 minutes scanning” with a monthly spreadsheet instead: “Low-tech but works.”
The first month is the long one, because you’re clearing a backlog and writing the theme list. After that you only add new rows. My guess is that a settled month sits nearer the 30-60 minutes than the 3 hours, but treat this as rough.
Is it worth it? That thread split on it:
- u/rrrx3: “If you’re at a small startup, you’re wasting your time doing this.”
- u/GeorgeHarter: “even if it took a day a month, it would be time well spent.”
I sit between them, so cap the time. When you track what users hate about competitor products, use the trend for positioning and pitch evidence, not for copying a competitor’s roadmap. If the hours still don’t add up for you, here are tools that read competitor reviews for you.
If You’d Rather Not Keep the Spreadsheet
If you want each theme’s trend over time without the spreadsheet, get early access: launch pricing is locked for a year for the first wave.
Get early access. If you’d rather keep the sheet, the six steps above work by hand.
FAQ
How often should I check competitor reviews?
Once a month on a fixed day is enough for most markets. Check sooner when a competitor announces a price or plan change, because that’s when bursts start: Clockify’s free-plan cut drew 8 Trustpilot price complaints in the four days from 16 June 2026.
Should I weight newer reviews more heavily?
Yes, when the product has shipped a change since the older complaints, which is the question @jimmyf0508 put to Mark Li on X. Keep older items in the count but flag them “may be fixed” once they pass 18 months, and treat any complaint that keeps appearing month after month as still live, whatever its age.
Is tracking competitor complaints worth it for a small startup?
Only if you time-box it and use it for positioning, not feature chasing. The objection on r/ProductManagement that “you’re wasting your time” holds if you copy a competitor’s roadmap from the complaints; it doesn’t hold for a capped monthly session that shows which complaint is rising and gives you dated evidence for a pitch.
Can I track GitHub issues for a closed-source competitor?
Only if it runs a public repo or a public community forum. Otherwise its review sites, app stores and Reddit threads carry the complaints, and GitHub skews toward power users anyway, so you lose less than you might think.