How to Analyze Competitor Reviews: 5 Steps, 1 Pattern Test
How to analyze competitor reviews in 5 steps: count each complaint per competitor, then test if it is a pattern or one loud reviewer. Shown on 5 time trackers.
To analyze competitor reviews, work through five steps: put every competitor’s complaints in one sheet, count each theme per competitor with its n (the number of review items behind the count), read each row against that competitor’s own n, run a five-check pattern test before you dismiss anything, and write one line per competitor. The pattern test tells a real complaint from one loud reviewer, and the ranking guides skip it: Xero’s UK guide says to “pay attention to recurring themes” without saying how many mentions make a theme recur, out of how many reviews, or across which competitors.
I research competitor reviews by hand before building anything: for this product I logged 36 tools in the category with their prices and 101 quoted complaints, each with its source and date. Every step below runs on one dataset: 261 negative items about five time trackers, coded by hand for the sample report.
Below: the five steps on that dataset, the full grid of ten complaint themes across five competitors, four real cases run through the pattern test, and what to do when someone hands you 500 reviews and 48 hours.
Key takeaways
- Five steps: one sheet, a count per competitor with its n, each row read against its own n, the pattern test, one line per competitor.
- Read each competitor against its own n: sign-in complaints are 28 of Toggl’s 98 items (29%) but only 37 of 261 (14%) across all five, so a market-wide table hides Toggl’s biggest problem.
- Before you call a theme a pattern or ignore it, check its share of n, its sources, spread versus burst, recency and a dated cause.
- A burst with a dated cause is still a pattern (Clockify’s 8 Trustpilot price complaints in four days after its free-plan cut); a burst without one gets weighted less (9 of Toggl’s 10 newest G2 reviews on one day).
- AI can sort 500 reviews into themes; you still need a count with n per competitor and the pattern test before you trust one.
Step 1: Set Up One Sheet for Every Competitor
Pick the competitors first (how to find the competitors worth reading), then fix one date window for all of them. My sample covers five time trackers (Toggl Track, Clockify, Harvest, Everhour and Timely) from 9 October 2024 to 8 October 2026.
Filter each source the same way for everyone:
- App Store and Trustpilot: 1 to 3 stars only. I read 2,685 App Store reviews, kept 859 at 1 to 3 stars and coded 178. Trustpilot: 88 read, 78 at 1 to 3 stars, 62 coded.
- G2 and Capterra: the cons field at any rating (G2: 60 read, 21 coded; my sample didn’t cover Capterra).
- Reddit: read for churn and switching, not counted in the grid (16 threads, 633 comments).
Why read the cons of a 5-star review?
Because that’s where my complaints were. u/erickrealz on r/SaaS says to “skip the one star and five star reviews”, but in my 7 October 2026 research most of the 101 complaints came from the cons fields of 4 and 5 star Capterra reviews. So skip neither end: keep the 1-star reviews, and on G2 and Capterra read the cons field of the 4 and 5 star reviews too.
For the sheet, I use the columns u/darvidas listed on r/SaaS (“source, rating, date, review text, product”), with the competitor in the product column, since every count in Step 2 splits on it. One review is one item, however many themes it carries.
Write down n per competitor before counting: Toggl 98, Clockify 78, Harvest 70, Timely 12, Everhour 3, so n = 261. “Everhour and Timely are thin samples,” in the report’s words.
Pile too big to read? That’s sampling and coding a pile of thousands. For the finished document, there’s a template with the dated, quoted columns.
Step 2: Count Each Theme per Competitor, With n
Code every item into a fixed list of themes, then count each theme per competitor. Every cell belongs to one competitor, and every column carries its n.
| Theme | Toggl (n=98) | Clockify (n=78) | Harvest (n=70) | Everhour (n=3) | Timely (n=12) | All five (n=261) |
|---|---|---|---|---|---|---|
| Price rises and paywalled features | 2 | 26 | 38 | 1 | 0 | 67 |
| Crashes and freezes | 9 | 12 | 8 | 0 | 12 | 41 |
| Logged out, sign-in and sign-up failures | 28 | 9 | 0 | 0 | 0 | 37 |
| Lost entries and sync failures | 17 | 9 | 7 | 0 | 0 | 33 |
| Clunky time entry | 17 | 7 | 2 | 0 | 0 | 26 |
| Missing features | 15 | 7 | 4 | 0 | 0 | 26 |
| Surprise charges, no refunds | 4 | 6 | 12 | 0 | 0 | 22 |
| Support unreachable | 14 | 3 | 1 | 1 | 0 | 19 |
| An update made it worse | 3 | 7 | 5 | 1 | 0 | 16 |
| Mobile app lacks web features | 5 | 3 | 3 | 1 | 0 | 12 |
Source: the sample report, 9 October 2024 to 8 October 2026.
One item can carry several themes, so a column can add up to more than its n: Toggl’s sums to 114 against 98, and the ten rows hold 299 theme tags across 261 items. Another 19 items fit no theme.
What does the “All five” column tell you on its own?
That price leads the market, at 67 of 261 items (26%). What it hides is whose price complaints those are: 38 are Harvest’s and 26 are Clockify’s, while Toggl has 2. Step 3 reads the rows one competitor at a time.
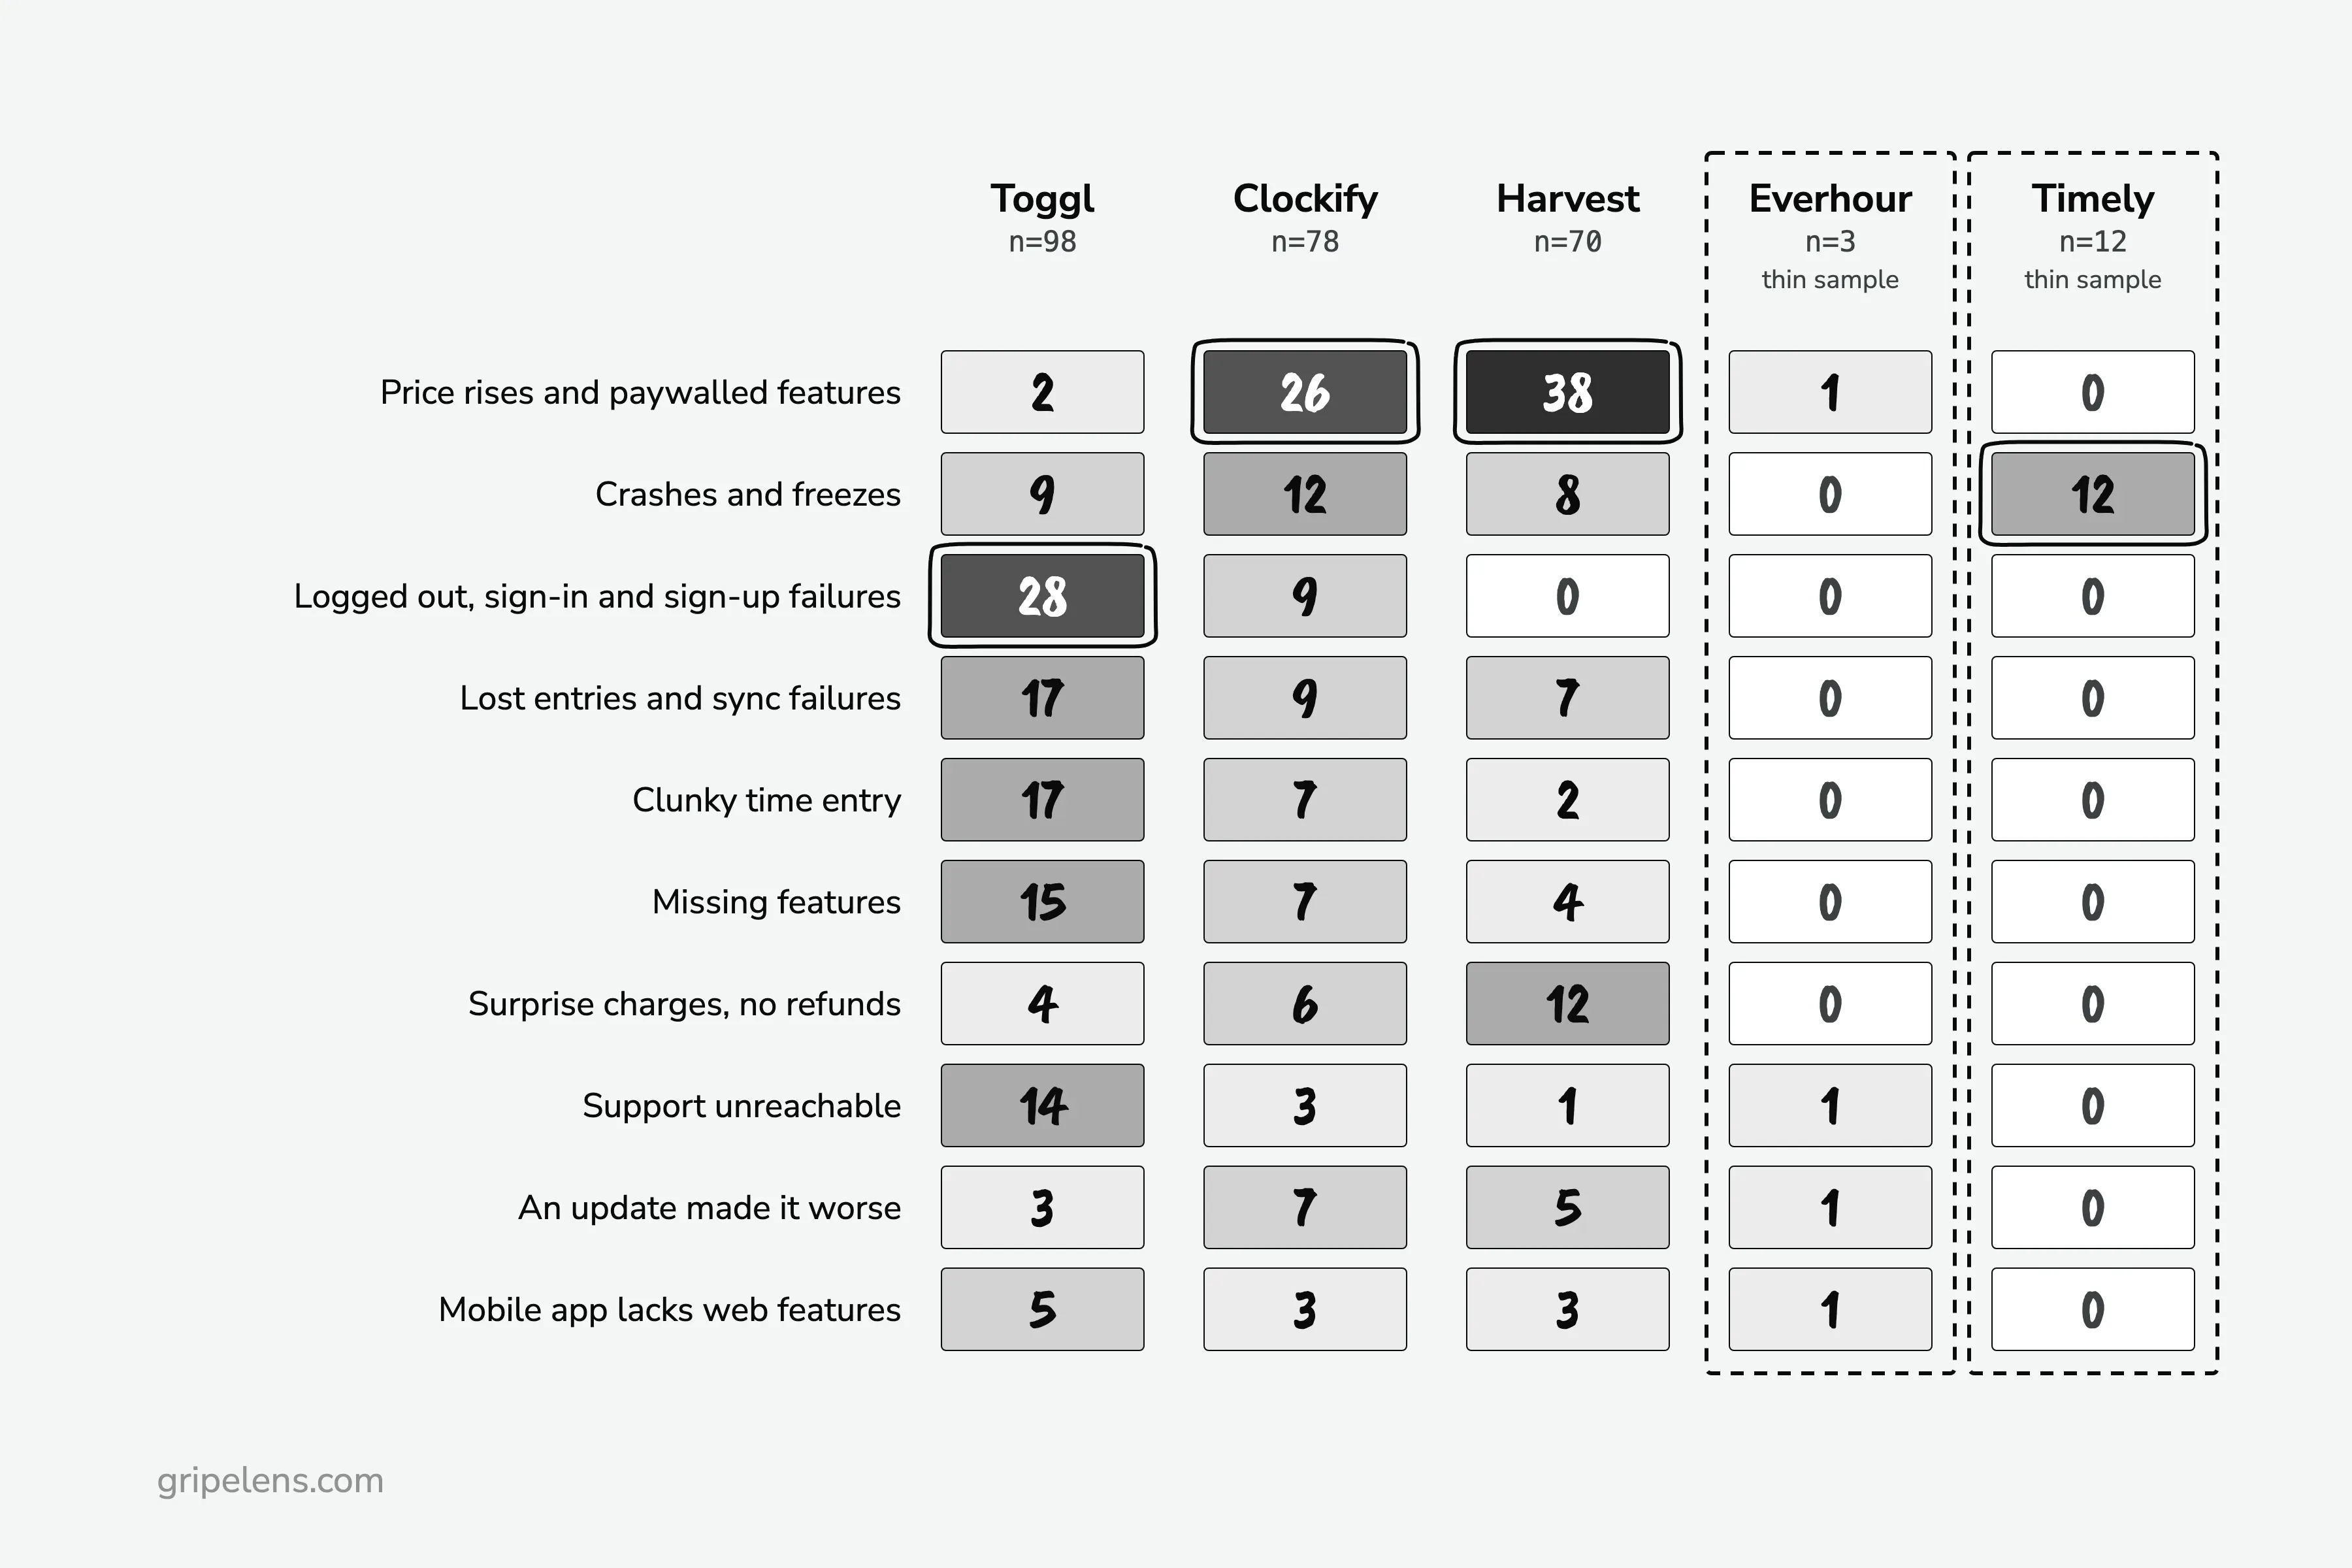
In the heatmap, the dashed columns are the thin samples: Everhour (n=3) and Timely (n=12).
Counting across three sources and five competitors is the slowest part of the job. Do it in the sheet, or have Gripelens do this step: the sample report shows the output format, grid included.
Step 3: Read Each Competitor’s Row Against Its Own n
A share of all 261 items describes the market. A share of one competitor’s items describes that competitor, and that’s the read you can act on:
- Toggl, sign-in: 28 of 98 (29%), against 37 of 261 (14%) across all five. Price is 2 of Toggl’s 98.
- Harvest, price: 38 of 70 (54%), against 67 of 261 (26%) across all five.
- Clockify, price: 26 of 78 (33%), against the same 26%.
- Toggl, support unreachable: 14 of 98 (14%), against 19 of 261 (7%).
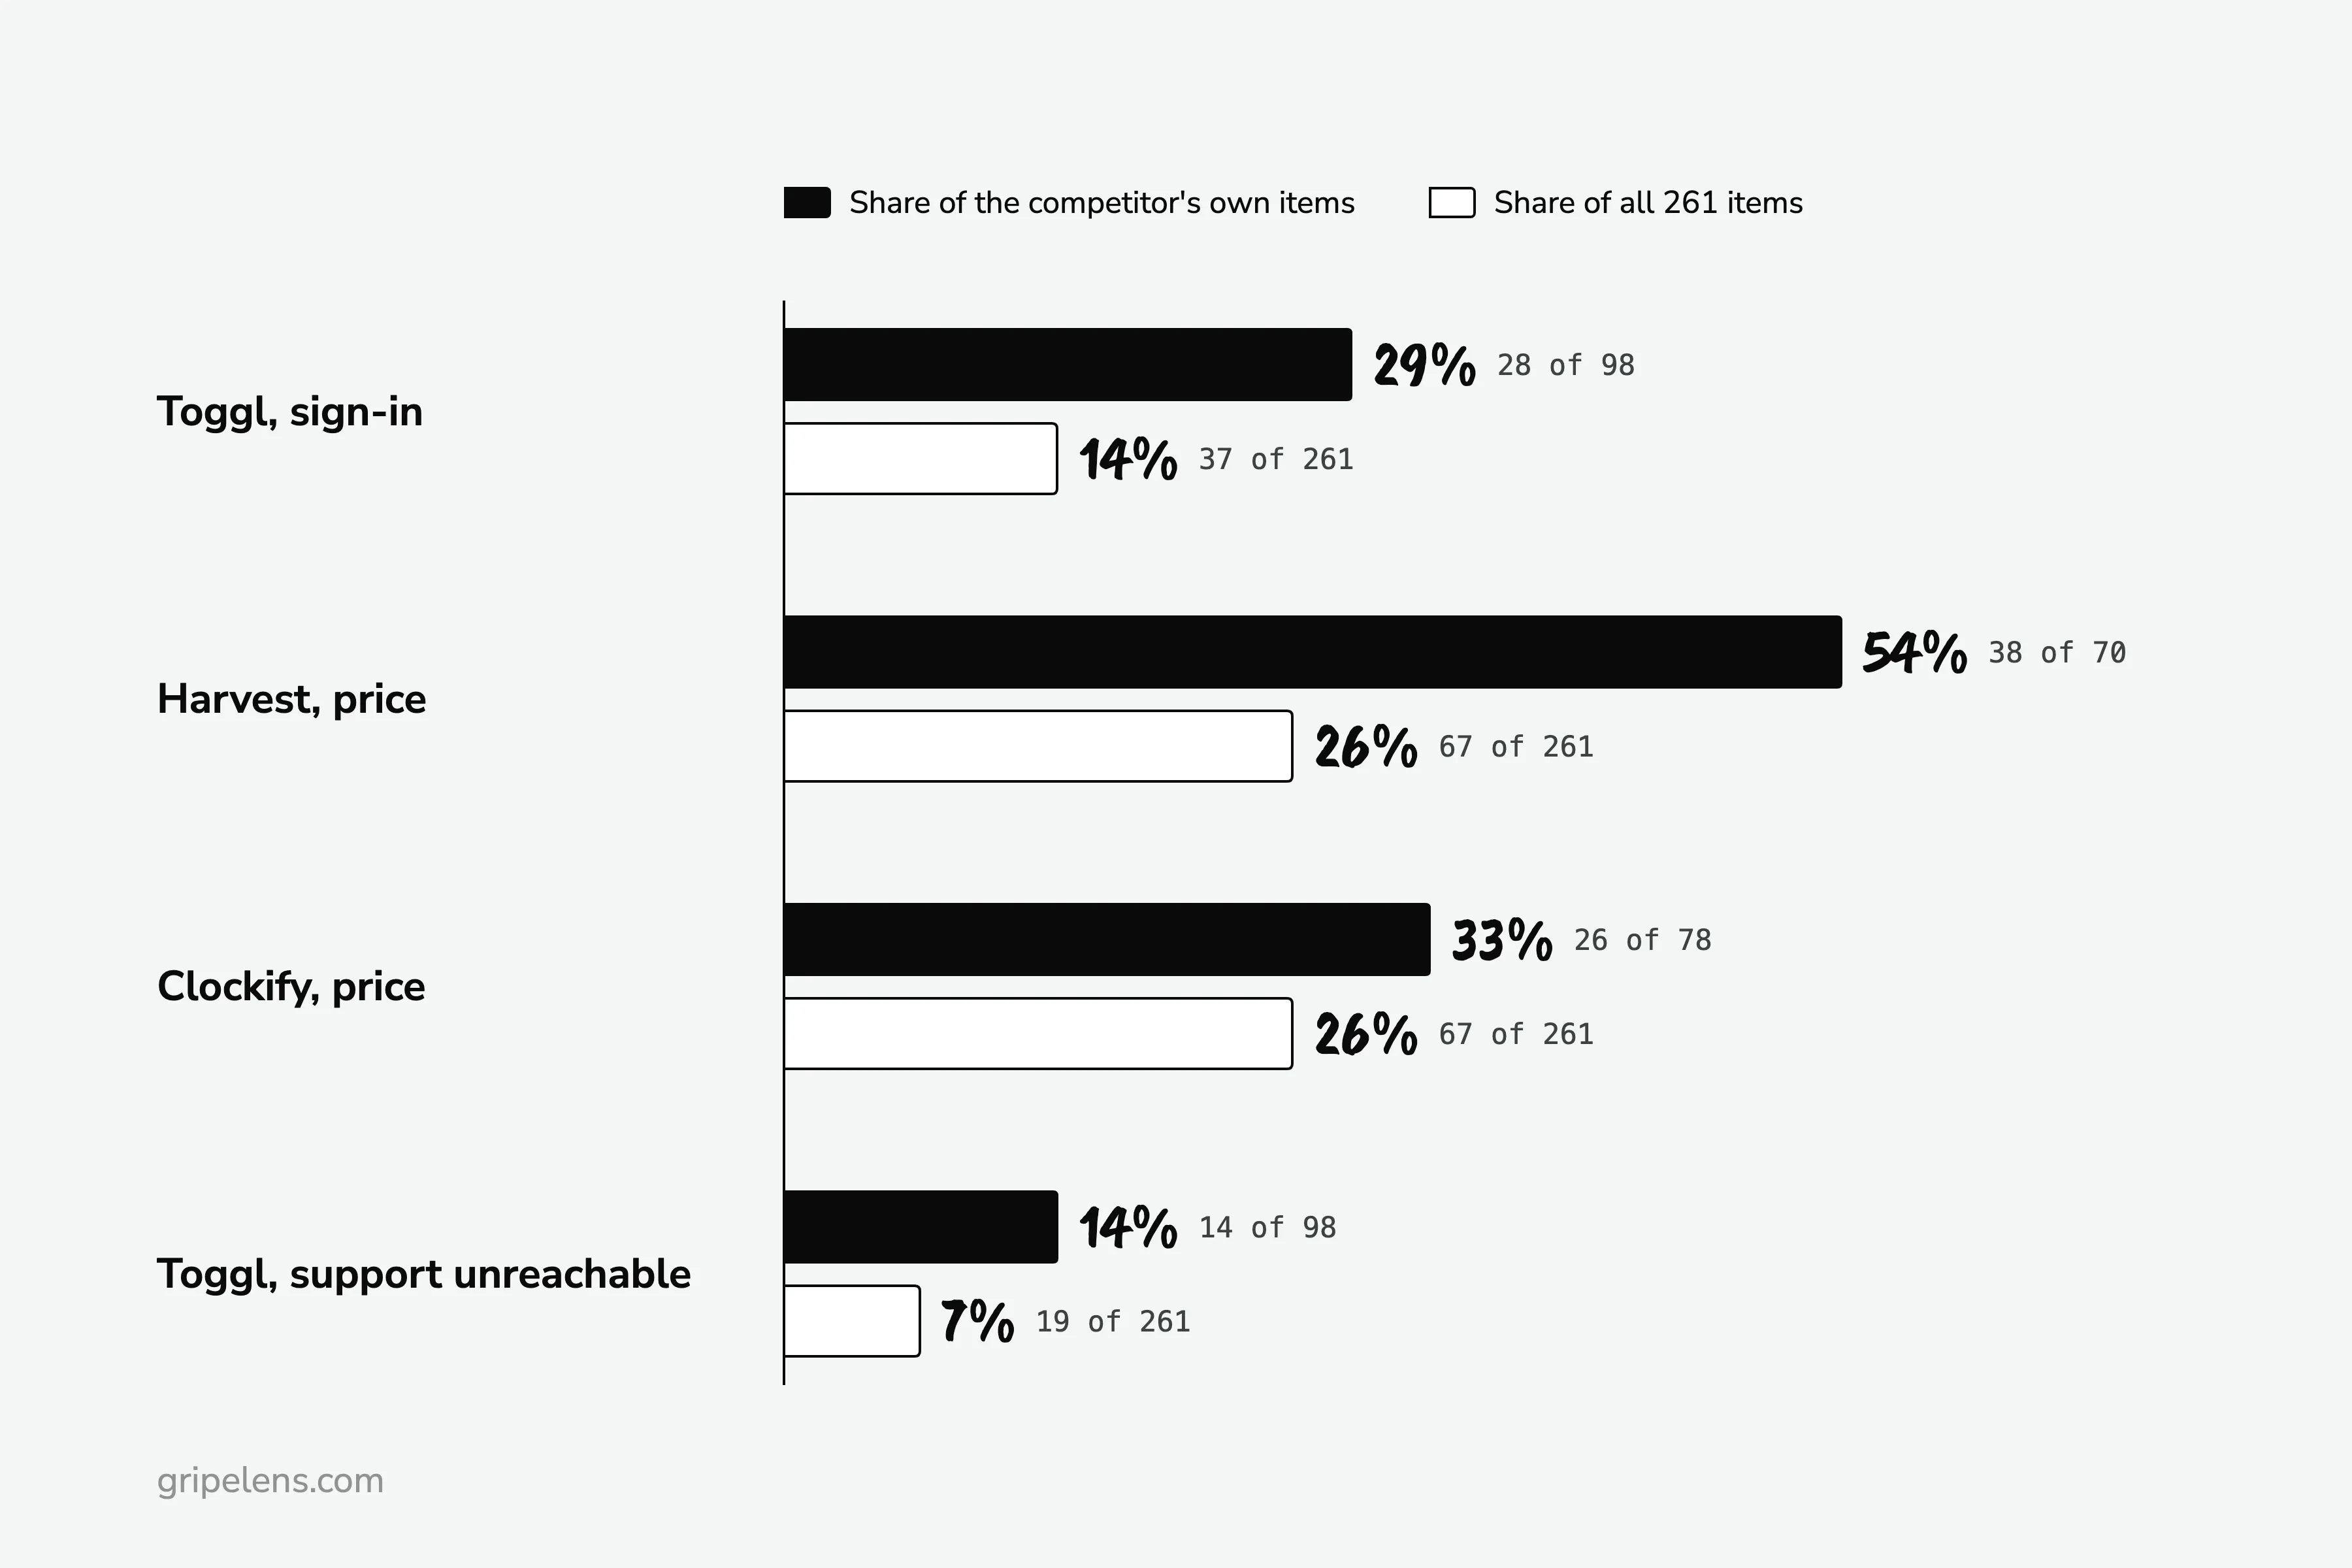
The market column says price. Toggl’s own row says its reviewers couldn’t get in.
Harvest’s share has a cause you can date: the 2026 repricing after the Bending Spoons acquisition, with reviewers quoting rises of 4x to 14x. “I pay around $12 as a freelancer with a few projects each month. Just got an email to say my price increase was going up to $113 PER MONTH.” (Harvest, 1 star, 13 Aug 2026, Trustpilot)
Clockify’s 26 trace to its free-plan cut, live from mid-June 2026: “I’m ok with a limited free version. I’m not ok with having to pay for features that once were available for free.” (Clockify, 1 star, 6 Jul 2026, App Store)
And Timely and Everhour?
Never put a share of Timely’s 12 or Everhour’s 3 next to a share of Toggl’s 98. Timely’s crashes are 12 of 12, which is 100% of a sample twelve items deep. Step 4 tests it.
Step 4: Run the Pattern Test Before You Ignore an Outlier
One loud reviewer and one bad week look the same until you date them. That’s why “ignore the outliers” is poor advice as a default: a small count can be a problem that has run for months, and a big count can be one afternoon of reviews.
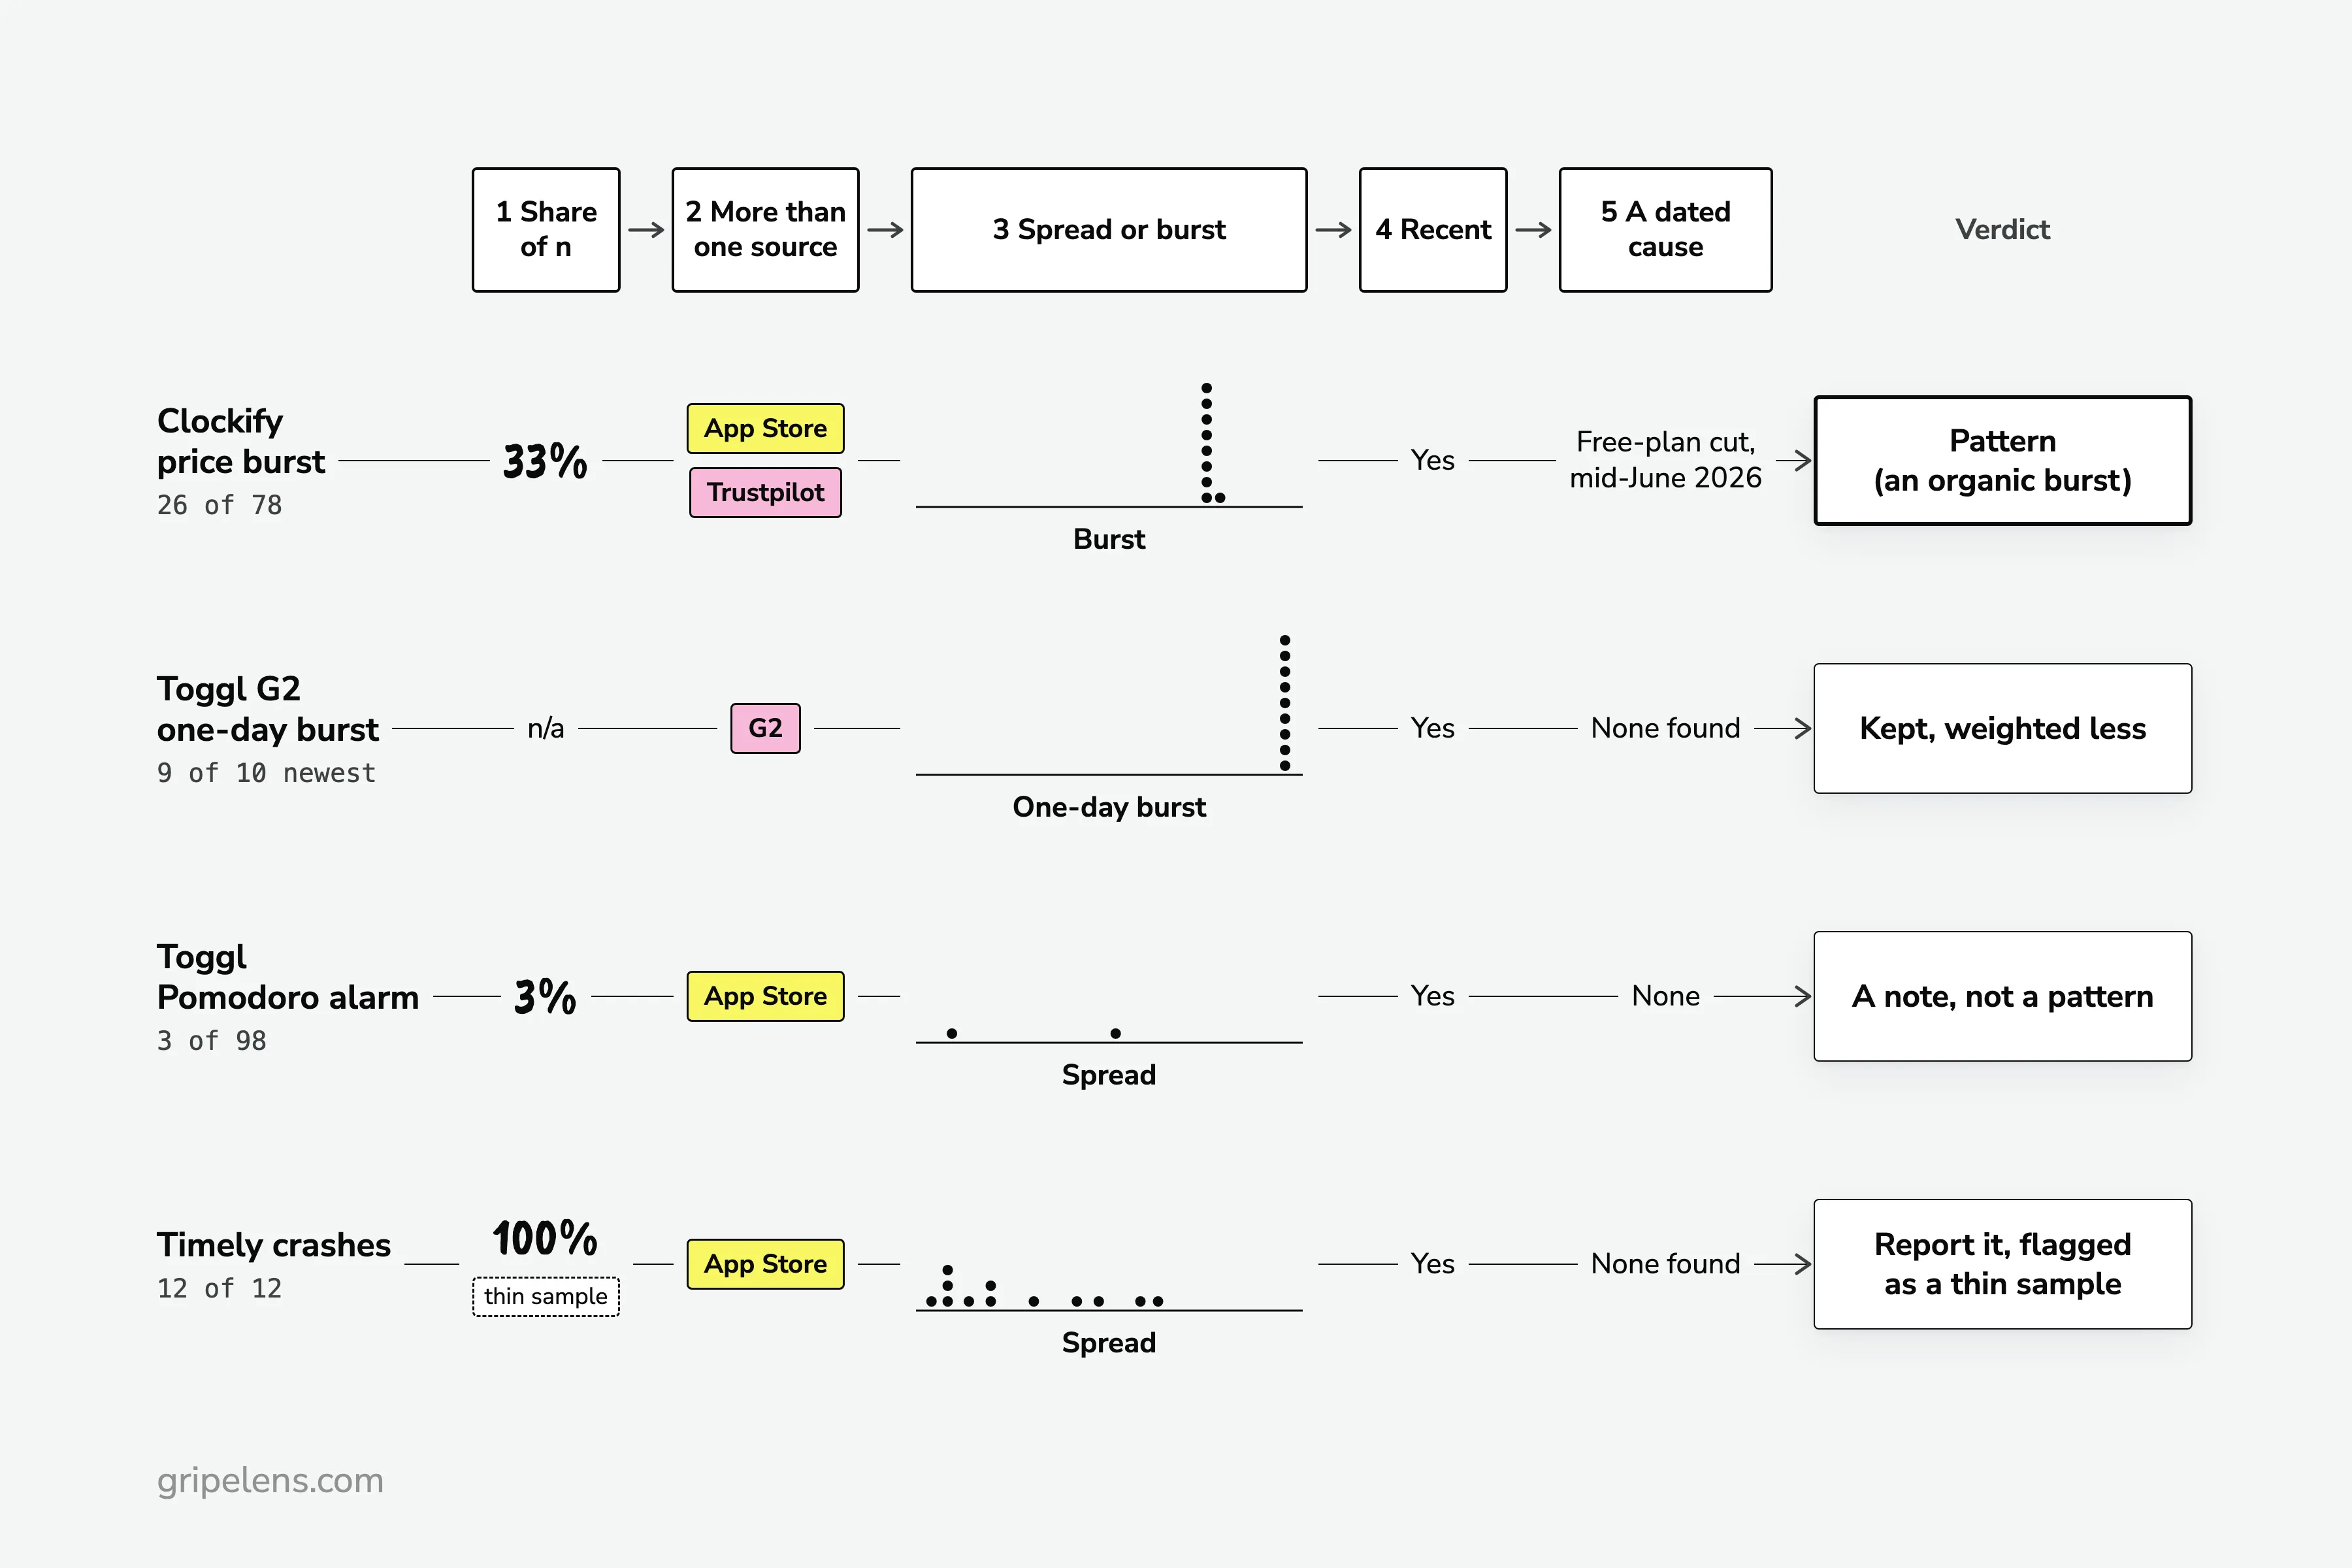
Run five checks on a theme before you call it a pattern or drop it:
- Share of n. The count with its base. A thin sample (Timely’s 12, Everhour’s 3) gets flagged, not compared.
- More than one source. App Store, Trustpilot, G2.
- Spread or burst. Many dates, or a few days.
- Recent. Inside 18 months of the run date. Older items get a “may be fixed” flag; in my sample, 53 of 261 items were older.
- A dated cause. A price change, a release, an acquisition.
Treat this as a rule of thumb from one dataset, not a statistical threshold. Four cases from the sample:
| Case | Count and n | Share of n | More than one source | Spread or burst | Recent | Dated cause | Verdict |
|---|---|---|---|---|---|---|---|
| Clockify price burst | 8 Trustpilot complaints, 16 to 19 June 2026, among Clockify’s 26 price items | 33% (26 of 78) | Yes: App Store and Trustpilot | Four-day burst, plus items outside it (6 Jul 2026, App Store) | Yes | Yes: free-plan cut, live mid-June 2026 | Pattern (an organic burst) |
| Toggl G2 one-day burst | 9 of the 10 newest Toggl G2 reviews, all dated 6 October 2026 | n/a | No: G2 only | One-day burst | Yes | None found | Kept, weighted less |
| Toggl Pomodoro alarm | 3 of Toggl’s 98 | 3% | App Store for the 2 dated items; the third isn’t recorded | Spread: 21 June 2025 to 8 February 2026, at least | Yes | None | A note, not a pattern |
| Timely crashes | 12 of Timely’s 12 | 100% of a thin sample | No: App Store only | Spread over 9 different months, 23 May 2025 to 9 April 2026 | Yes (last 9 April 2026) | None found | Report it, flagged as a thin sample |
The date check behind the Toggl row is in dating reviews to spot review drives.
So is a small count just noise?
Not the Pomodoro alarm. Three items, one competitor, 3% of Toggl’s n, but spread over more than seven months, and the reviewer on 8 February 2026 wrote “still not implemented”. That makes it a note to watch, not a theme. The receipt: “How is a timer that doesn’t ring when it’s done supposed to be useful exactly?” (Toggl, 1 star, 21 Jun 2025, App Store)
Timely fails the other way. One theme fills all 12 items, from one source, over nine different months with no burst. That consistency is why I report it; the 12 is why I flag it. In the report’s words, “Timely’s iOS app does not open.”
Step 5: Write One Line per Competitor and Act on It
The output is one line per competitor, written from its own row and the pattern test. For the five time trackers, the report’s line is: “Harvest users complain about money, Toggl users about getting in and keeping their entries, Clockify users about both, and Timely’s iOS app does not open.” That line describes the rivals; review mining for positioning turns one rival’s part of it into a line for your own landing page.
Everhour gets no line. Its 3 items support nothing, and I didn’t count its 10 Trustpilot reviews, all 5 stars: I noted them as solicited.
What do you do with the lines?
Give each one a job:
- Positioning and sales. On r/ProductManagement, u/estupidoduckface puts it plainly: if a competitor has a lot of negative reviews for a feature, “you can drive that point in sales calls and position yourselves above them for that feature”. In the same thread, u/valerocios argues a PM needs “the feature set and tech stack, not the customer reviews”.
- Switching. Who people leave for. Of 24 Reddit comments in the sample that name the tool someone moved to, 9 name Keito, 4 name Clockify, 4 say they built their own and 2 name Productive.
- Roadmap. A theme that passed the test goes in. A note, like the Pomodoro alarm, gets watched.
One rule for every line: it carries a dated, linked quote, and anything older than 18 months at the run date gets flagged “may be fixed” (53 of 261 items in the sample).
What If You Have 500 Reviews and 48 Hours?
That’s the question u/AlexCaceres1 put to r/SaaS on 10 August 2025: “If you had to analyze 500 reviews from 3 competitors in 2 days”, with the reviews “spread across App Store, G2, Trustpilot and Reddit”.
The commonest answer was AI: “Just feed it to AI” or “scrape and feed to AI” shows up in 5 of its 18 comments, and only one of those five, from u/darvidas, adds a human check.
The u/darvidas workflow: merge everything into one sheet (the columns from Step 1), let ChatGPT or Claude group the reviews into themes, then read about 10 to 20 reviews per theme, “Just to sanity-check and grab good quotes. That way I’m not manually reading 500+ from scratch.”
The one-prompt habit on X skips even that: give Claude three competitor websites and ask it to analyze their prices, offers, messaging and customer reviews, with no count asked for anywhere.
Is a list of themes enough to act on?
No. Add two checks before you trust what the AI hands back:
- A count with n per competitor per theme (Steps 2 and 3). A theme list with no counts can’t tell Harvest’s 38 of 70 from Toggl’s 2 of 98.
- The pattern test on every theme you plan to act on (Step 4). The 10 to 20 reviews you read per theme supply the dates and sources it needs.
So split the 48 hours that way. AI saves you the coding pass; the counting and the five checks are what you spend the second day on.
Or compare tools that do the counting before you build anything.
If You’d Rather Not Build the Grid by Hand
If you want the grid, the sample sizes and the burst flags for your own competitors without building the sheet, Gripelens builds them for you.
Get early access: launch pricing is locked for a year for the first wave. If you’d rather keep the sheet, the five steps above work by hand.
FAQ
How many competitor reviews do I need to analyze?
There’s no fixed number. Write down the n for each competitor before you count anything, and flag thin samples instead of comparing their shares: in my time-tracker sample, Timely had 12 items and Everhour 3, so neither went side by side with Toggl’s 98.
Should I ignore outliers in competitor reviews?
Not before the five checks. A small count spread over months, like the Pomodoro alarm at 3 of Toggl’s 98, is a note to watch. A one-day burst with no cause gets weighted less, not deleted, and a burst with a dated cause, like Clockify’s free-plan cut, is still a pattern.
Can I use ChatGPT or Claude to analyze competitor reviews?
Yes, for grouping reviews into themes. Then count each theme per competitor with its n, and read 10 to 20 reviews per theme for the dates, sources and quotes, which is what u/darvidas does on r/SaaS. Without those two steps you have a list of themes, not evidence.
Which reviews should I read: 1-star, 3-star or 5-star?
Read 1 to 3 star reviews on the App Store and Trustpilot, plus the cons field at any rating on G2 and Capterra. In my 7 October 2026 research, most of the 101 complaints came from the cons of 4 and 5 star Capterra reviews, so skipping the top ratings would have lost most of them.